Contents
Using the  View Object schema button the Object tree can be set to a schematic representation.
It then shows all available object like instruments, graphs, meters, I/Os etc. in a schematic representation,
using blocks for all objects.
All connections between inputs and outputs are shown as well.
View Object schema button the Object tree can be set to a schematic representation.
It then shows all available object like instruments, graphs, meters, I/Os etc. in a schematic representation,
using blocks for all objects.
All connections between inputs and outputs are shown as well.
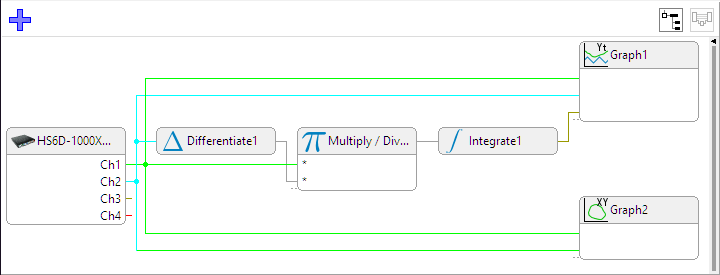
In the Object schema you can add and remove objects and make connections between inputs and outputs of objects, by dragging lines between outputs and inputs. That allows to perform the required calculations on the measured data and to display the data in meters and graphs.
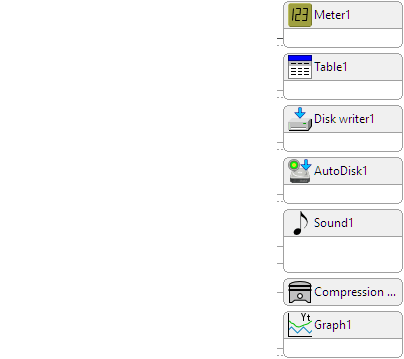
Objects
All objects are represented as rectangles, with a gray title section, including an icon representing the type of object. The title of the object can be:
- the name of the object
- the alias of the object, when filled in
- the value of a characteristic property of the object, e.g. the cut off frequency of a filter
When the title of the object is longer than the available space, hovering the mouse will show a hint with the full name. When an object has more than one input or output, an additional section in the rectangle is shown, which can hold the names of the inputs and/or outputs.
Inputs are located at the left hand side of the object, represented as small connection lines, to which lines can be connected. When an object supports a variable number of inputs, a dashed connection line is drawn at the lower left of the rectangle, to connect a new signal to. Outputs are located at the right hand side of the object, also represented as small connection lines, to which lines can be connected. When an output has a color assigned (e.g. the channel of an instrument), the connection line will be drawn in the same color.
Double clicking the object will open its settings window. Right clicking the object will open the popup menu of the object, in which all settings for the object can be made. Right clicking an output of a source (e.g. a channel of an instrument) will open the popup menu for the output.
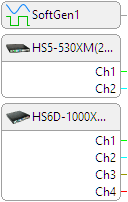
Sources
Sources have one or more outputs. Sources are always located at the left hand side of the schema.
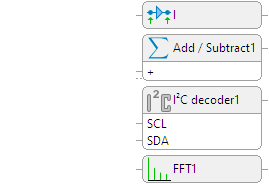
I/Os
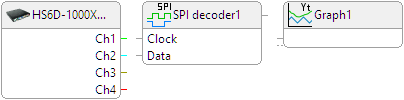
I/Os have one or more inputs and also one or more outputs. When the input has a specific function, its name will be displayed next to the connection line. I/Os are located in the middle area, between the sources and the sinks.
Sinks
Sinks have one or more inputs. Sinks are always located at the right hand side of the schema.
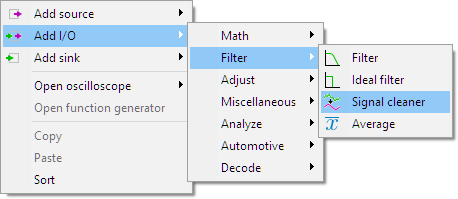
Creating objects
To create a new object in the Object Schema, either click the
 Add object button or
right-click anywhere in the Object schema next to an object.
That opens the Object Schema popup menu in which sources, I/Os and sinks can be selected and created.
The new object is placed below the existing objects in the schema.
Add object button or
right-click anywhere in the Object schema next to an object.
That opens the Object Schema popup menu in which sources, I/Os and sinks can be selected and created.
The new object is placed below the existing objects in the schema.
Connecting objects
To make an I/O or Sink process the data from a source, that source must be connected to the object.
Simply draw a line from a specific output of a source to an input of another object.
When the mouse is correctly placed over the output, the output will be highlighted.
When the drawn line is correctly located over the input it is to be connected to, the mouse cursor will change
( ),
at that moment the mouse button can be released and the connection will be made.
The animation below shows connecting two scope channels to an Add/Subtract I/O and the output of the I/O to a graph.
),
at that moment the mouse button can be released and the connection will be made.
The animation below shows connecting two scope channels to an Add/Subtract I/O and the output of the I/O to a graph.
Connection lines are drawn in the color that is assigned to the output they are connected to. E.g. scope channels have a color assigned, if a connection is made to a channel, the line will get the same color as the channel. Lines connected to the output of an I/O will get the color that is determined by the color setting of the I/O. Lines for which no color can be determined, are drawn in dark gray.
To make a connection from an existing connection (line) to another object input, simply place the mouse over the line to connect to and press the left mouse button. The line will now be highlighted. Then draw to the object input to connect to and release the mouse button again.
Connecting objects between other objects
Suppose a streaming measurement is performed where Channel 1 is connected to a Data Collector I/O and the data needs to be filtered before collecting it in the Data Collector I/O. A Filter I/O then has to be inserted between the channel and the Data Collector input.
To do that, select the input where the new object has to be placed in front of. Then right-click the input and use Insert I/O from the popup menu to select the required I/O. Then the new object will be placed between the existing objects.
Removing connections and objects
To remove a connection between objects, select the line by clicking it with the mouse. When the mouse hovers the line, it will be highlighted, to indicate which line will be selected. Selecting it by clicking it will draw the line in a bold blue line. Now pressing Del will remove the connection between the objects.
To remove an object, click it with the mouse to select it. When it is selected, it will be outlined by a blue line. Pressing Del will remove the object, including all its connections, but leaving connections between other objects intact.
Rearranging objects
The Object Schema tries to arrange the objects in such way that connections between object are easy to follow. Scopes with their channels are always located at the left hand side, sinks like e.g. graphs and meters are always located at the right hand side. And I/Os are located in between. Objects are ordered from top to bottom in a chronological order of how they are created. Objects always align to a fixed grid.
The order in which objects are listed in the Object Schema can be changed. This can be useful when e.g. the setup has been modified because objects were inserted or removed.
To change the location of an object in the schema, simply pick it up with the mouse and drag it to the required location. When a valid location is found, that area will be highlighted, after which the mouse button can be released. The object will be moved to that location, connection lines are moved accordingly. Objects connected behind the object that is moved may also be moved to a new location.
When the total schema of objects is larger than what currently fits in the window, scrollbars are shown, to pan the viewport. When moving an object to a location outside the viewport, position it at the egde of the viewport, the viewport will then automatically pan into that direction.
When an object is being dragged to a new location, small circled numbers are projected on each object. These numbers indicate the order in which the objects are ordered in the internal object list. When manually rearranging objects, these numbers are not changed.
Rearranging the objects can also be done automatically. Right-clicking anywhere in the object schema will open the popup menu for the object schema, with the option Sort. Using the original order of the objects in the internal object list and their interconnections, the Sort action will try to order the objects in the most convenient way. The order of the objects in the internal object list will be updated as well.
When the setup is saved to disk, to a .TPS file, all locations of the objects are stored as well, so when loading the file again in a later stage, the objects will be ordered in the same way.